RISK DISCLAIMER: This report is for informational and educational purposes only and does not constitute financial advice.
Trade levels (entry, stop, target) are derived from technical analysis and are not guarantees of future performance.
Always conduct your own due diligence.
Chart — AA 3-Hour View (2026-04-29)
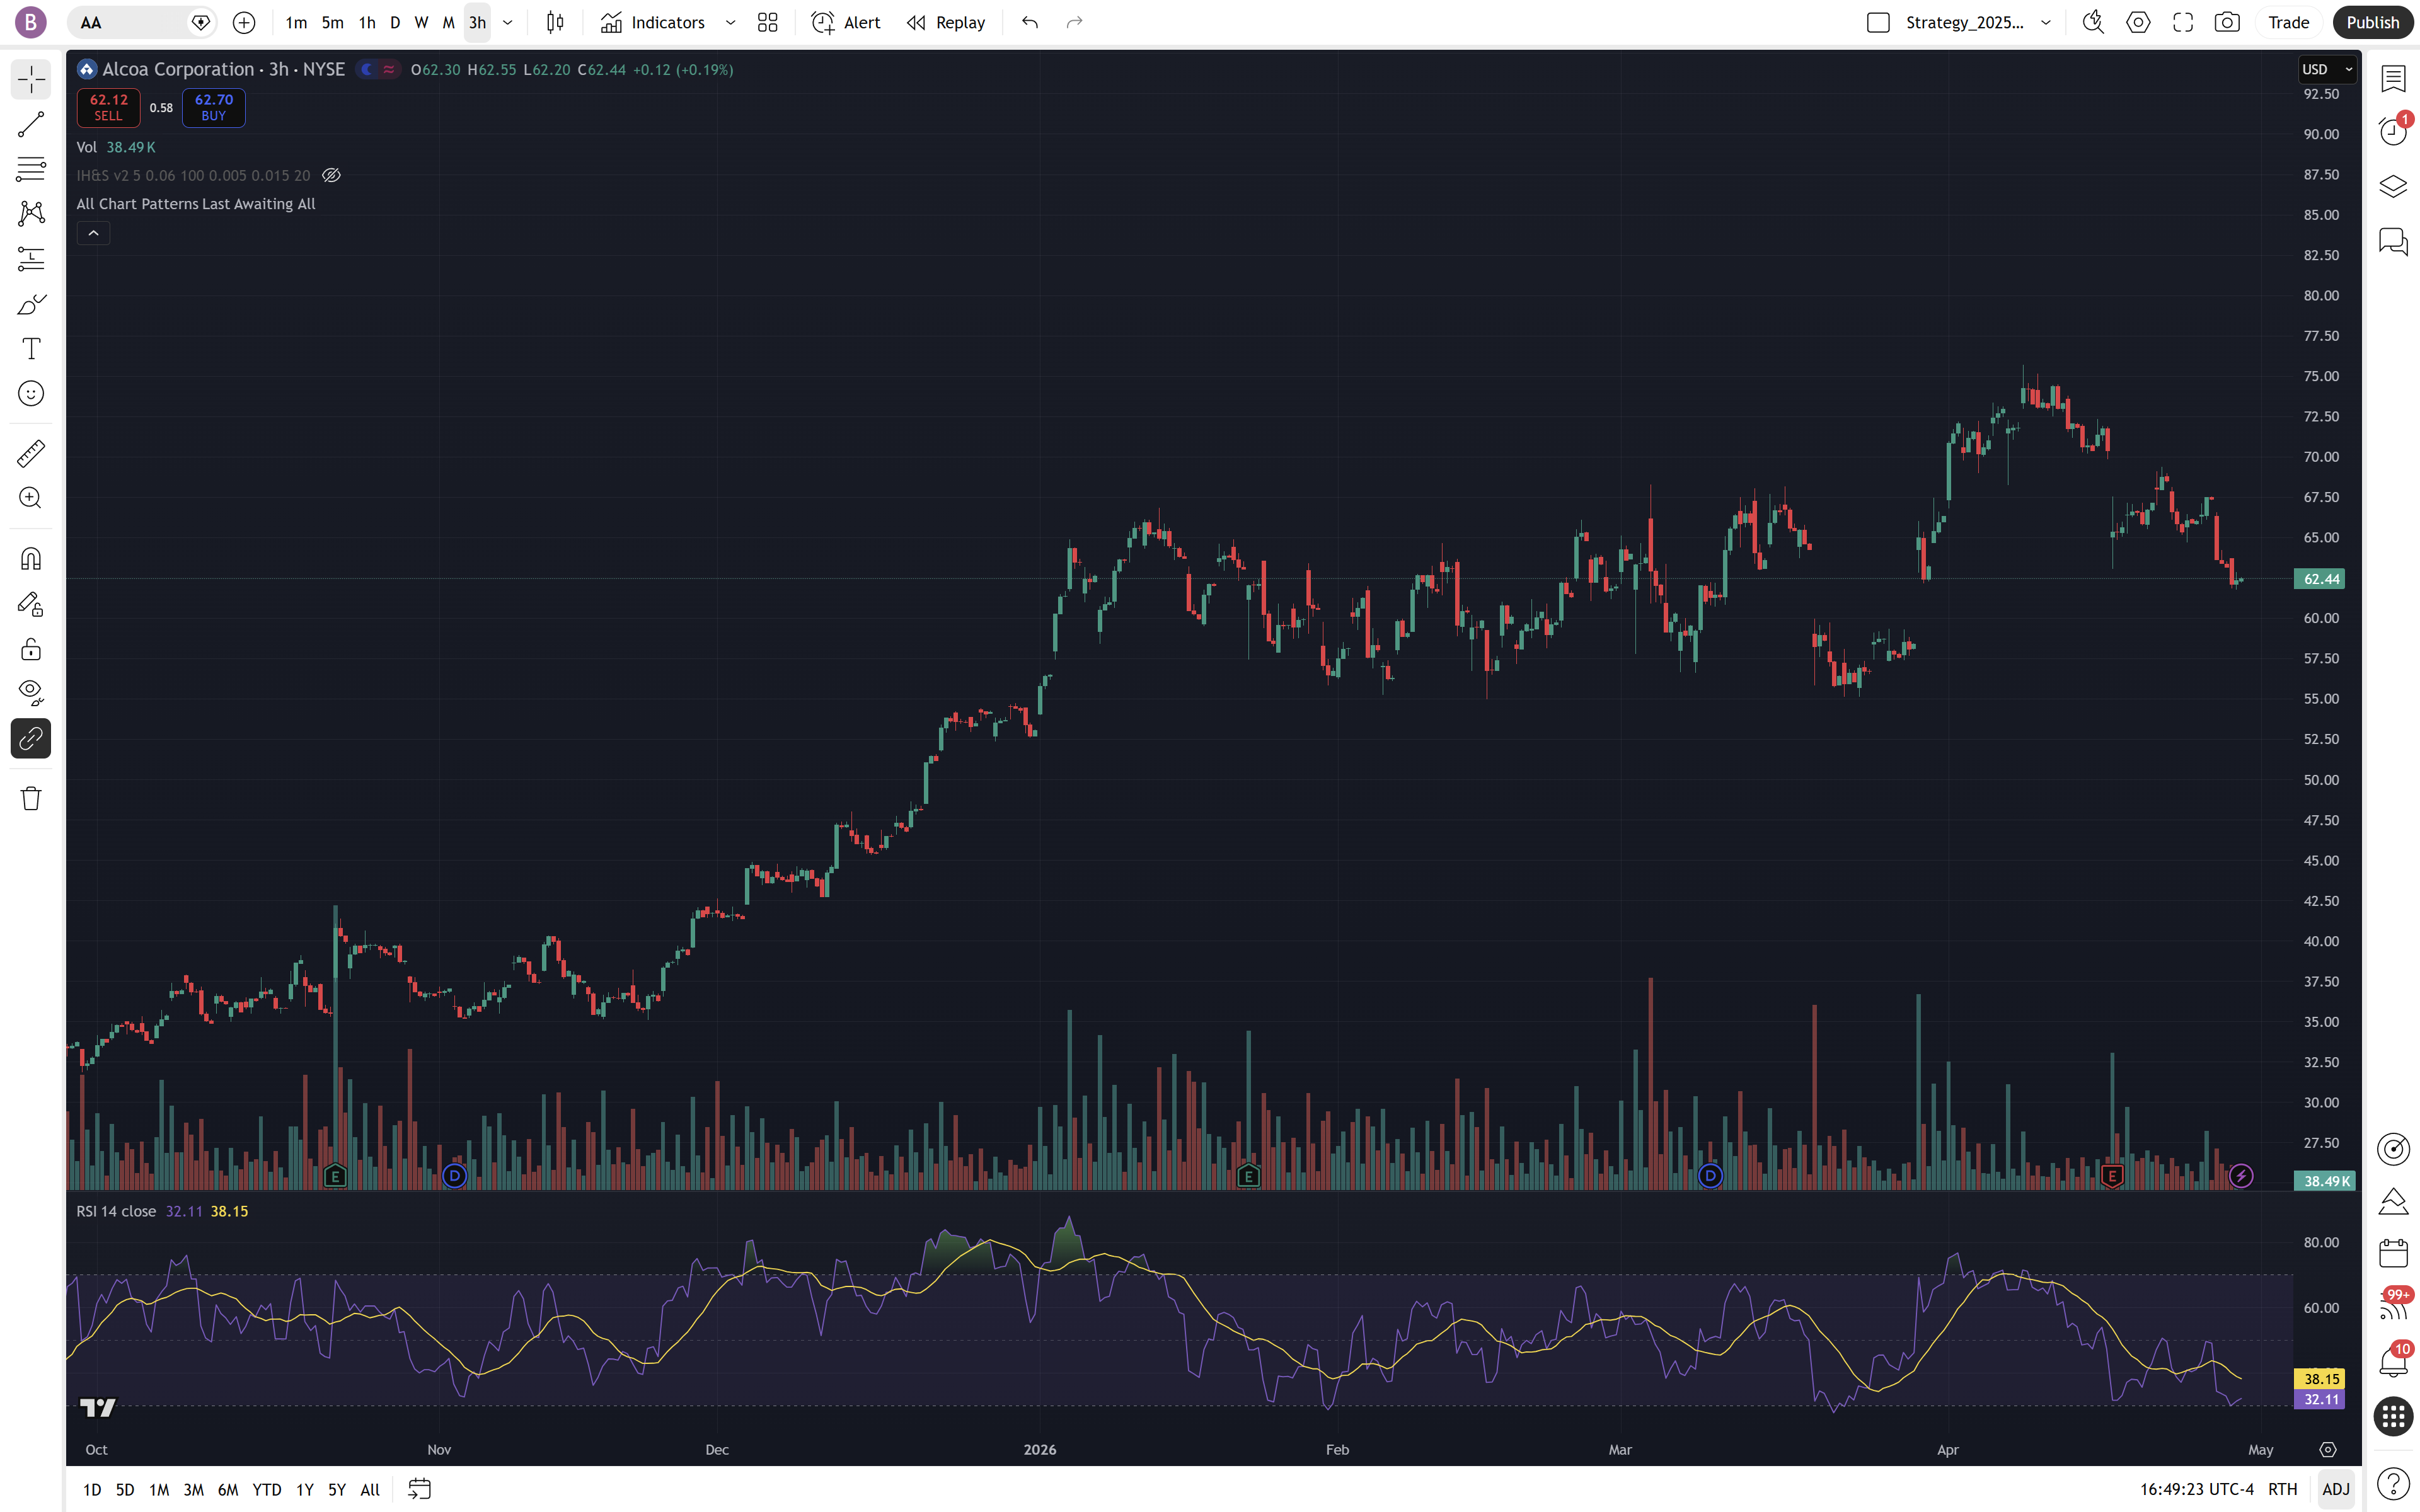
▼ 17% Pullback from Peak
RSI ~32 — Near Oversold
Structural Support: $55-$60
Target: $75.00+
3-Hour chart. AA is testing the support zone established in early 2026. RSI (bottom panel) has collapsed to 32.11, signaling that the selling momentum may be exhausted.
Ticker
AA
NYSE — Alcoa Corp
Current Price
$62.44
In Pullback Zone
Recent High
$75.00
Primary Resistance
Base Support
$55.00
Structural Floor
Extended Target
$85.00
Trend Extension
Hard Stop
i
The 'Exit' price. If price hits this level, the rebound thesis is invalidated.
$54.00
Below base support
Pattern
i
Visual price structure. Currently showing a 'Mean-Reversion Pullback' following a strong rally.
Rebound
Oversold / Retest
Risk/Reward
i
Potential loss vs. profit. 1:1.5 to 1:2.7 depending on entry confirmation.
1 : 2.5
From $60.00 base
Key Price Level Map
Bullish Targets
Extended Breakout Target
$85.00
Secondary target if the $75 resistance is cleared.
Recent Peak / Major Resistance
$75.00
Primary recovery target. Expect sellers to defend this level.
Support Zones
Immediate Pivot / Support
$60.00
Psychological and technical floor. Initial rebound expected here.
Structural Base Floor
$55.00
Hard structural support. Institutional buyers have loaded here previously.
Invalidation Level
$54.00
Stop loss. Below this, the bullish trend is officially broken.
Entry Plays — Long Setups
| # | Play | Signal Type | Status | Entry Zone | Stop Loss | TP1 | TP2 | Best R/R | Trigger Condition |
|---|---|---|---|---|---|---|---|---|---|
| 1 |
LONG-1
Rebound
|
LONG | LIVE / NOW | $58.00 – $60.00 | $54.00 | $68.00 | $75.00 | 1 : 2.8 | RSI crosses up from 30 + Price @ support |
| 2 |
LONG-2
Conservative
|
LONG | PENDING | $65.00 – $67.00 | $60.00 | $75.00 | $85.00 | 1 : 2.0 | MACD bullish cross + RSI > 40 |
| 3 |
LONG-3
Breakout
|
LONG | PENDING | $75.25 – $76.00 | $70.00 | $85.00 | $95.00 | 1 : 2.1 | Close above $75.00 peak + volume spike |
Pine Script v6 Reference — AlertEdge.io_AA_Entry_Signals.pine
// File: tickers/AA/AlertEdge.io_AA_Entry_Signals.pine
// Rebound & Momentum Strategy for Alcoa Corp
LONG-1 Rebound → Grey ● circle below bar | text = "REBOUND"
LONG-2 Momentum → Green ↑ arrow below bar | text = "BUY"
LONG-3 Breakout → Orange ▲ triangle below bar | text = "BREAK↑"
// Automatic Levels: Support $55.00 | Resistance $75.00 | Target $85.00
// Alert conditions fire on RSI recovery and MACD crossovers.