RISK DISCLAIMER: For informational purposes only. Not financial advice. Revalidate all levels against live price before trading.
Access Mode: Free Preview. Exact levels are subscriber-only.
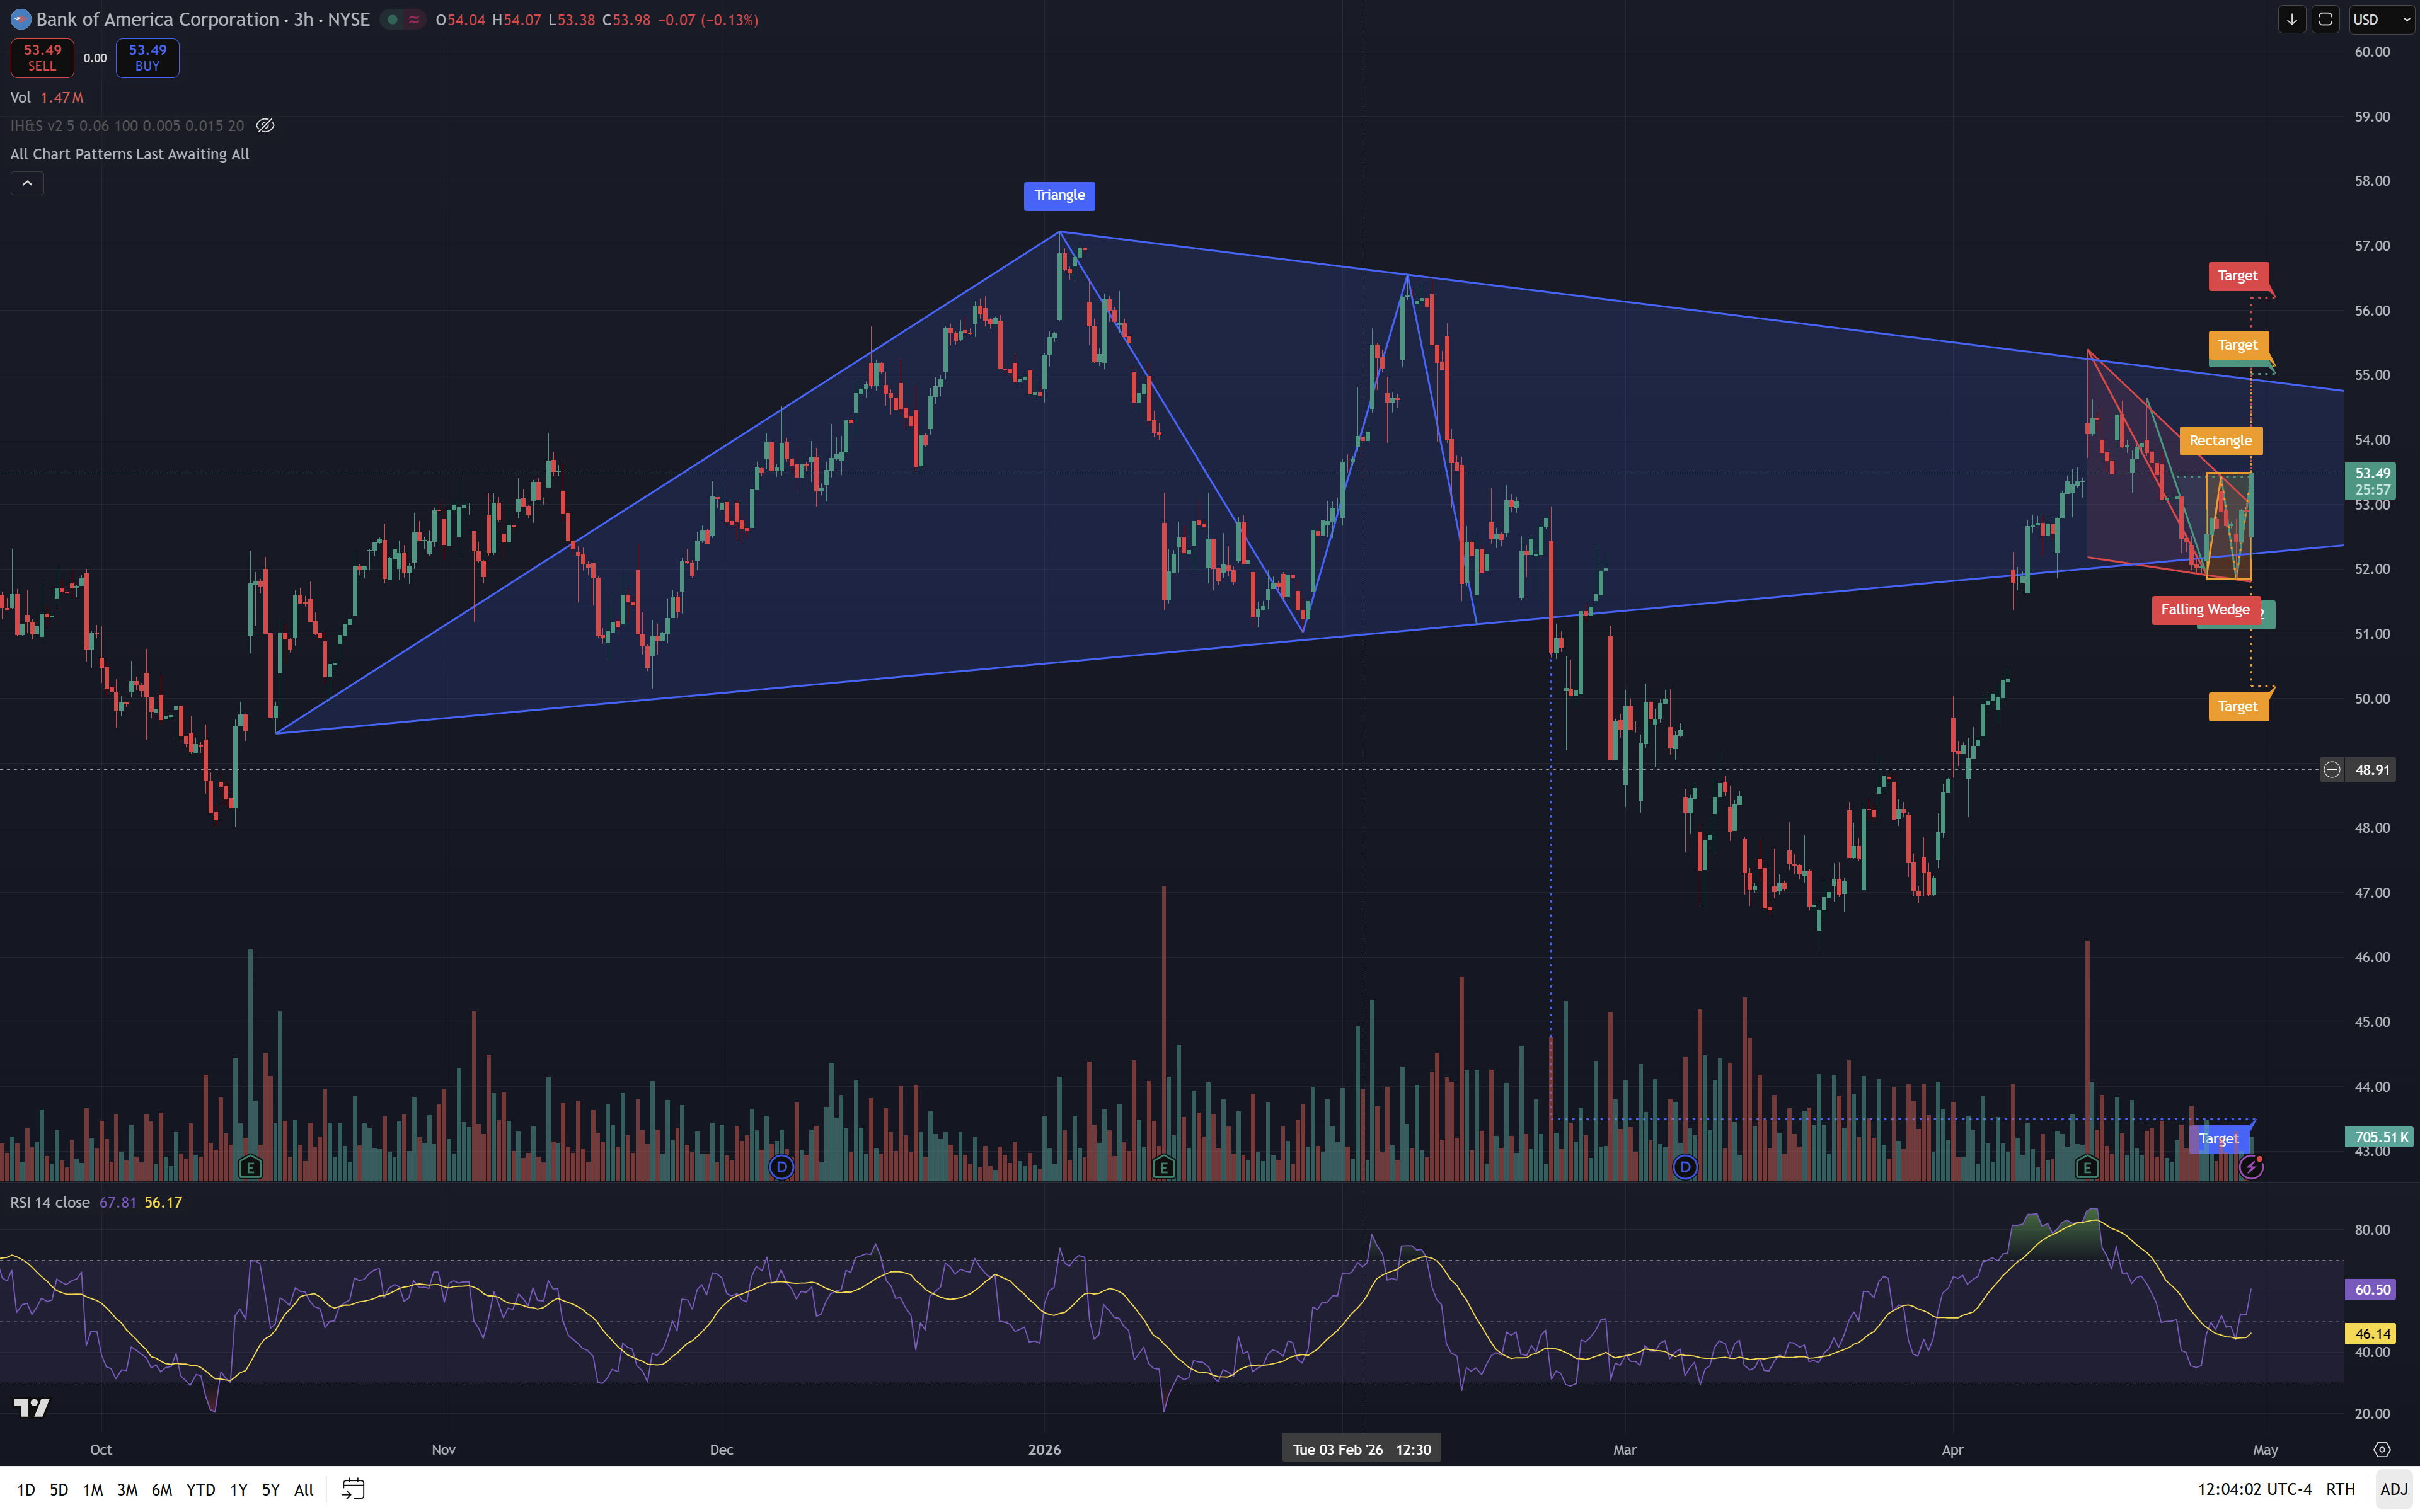
BAC Setup
Triangle Consolidation
Entry ZoneSubscriber Only$51.80 – $53.90
TriggerSubscriber Only$54.20
StopSubscriber Only$50.00
Target 1Subscriber Only$55.00
Target 2Subscriber Only$56.70
Snapshot
Fundamentals
Price$53.38
Market Cap$383.1B
P/E13.2x
Dividend2.08%
1-Day Chg0.95%
Rel Vol0.23x
Entry Plays
| # | Play | Signal | Status | Entry Zone | Stop | TP1 | TP2 | Condition |
|---|---|---|---|---|---|---|---|---|
| 1 | LONG-1 Compression Hold |
LONG | WATCH NOW | Subscriber Only$51.80 – $53.90 | Subscriber Only$50.00 | Subscriber Only$55.00 | Subscriber Only$56.70 | Support holds while price compresses under resistance. |
| 2 | LONG-2 Triangle Break |
LONG | PENDING | Subscriber Only$51.80 – $53.90 | Subscriber Only$50.00 | Subscriber Only$55.00 | Subscriber Only$56.70 | Close above the upper triangle boundary. |
| 3 | LONG-3 Range Expansion |
LONG | PENDING | Subscriber Only$51.80 – $53.90 | Subscriber Only$50.00 | Subscriber Only$55.00 | Subscriber Only$56.70 | Breakout follow-through into the measured target zone. |
Pine Script Reference
// AlertEdge.io_BAC_Entry_Signals.pine
// Alerts focus on triangle break and support-loss invalidation.
LONG-1 Support Hold → teal circle below bar
LONG-2 Breakout → orange triangle below bar
STOP Invalidation → red X above bar
// Alerts focus on triangle break and support-loss invalidation.
LONG-1 Support Hold → teal circle below bar
LONG-2 Breakout → orange triangle below bar
STOP Invalidation → red X above bar