RISK DISCLAIMER: This report is for informational and educational purposes only and does not constitute financial advice.
Trade levels (entry, stop, target) are derived from technical analysis and are not guarantees of future performance.
Always conduct your own due diligence. Past price patterns do not guarantee future returns.
Chart — WT 3-Hour View (2026-04-29)
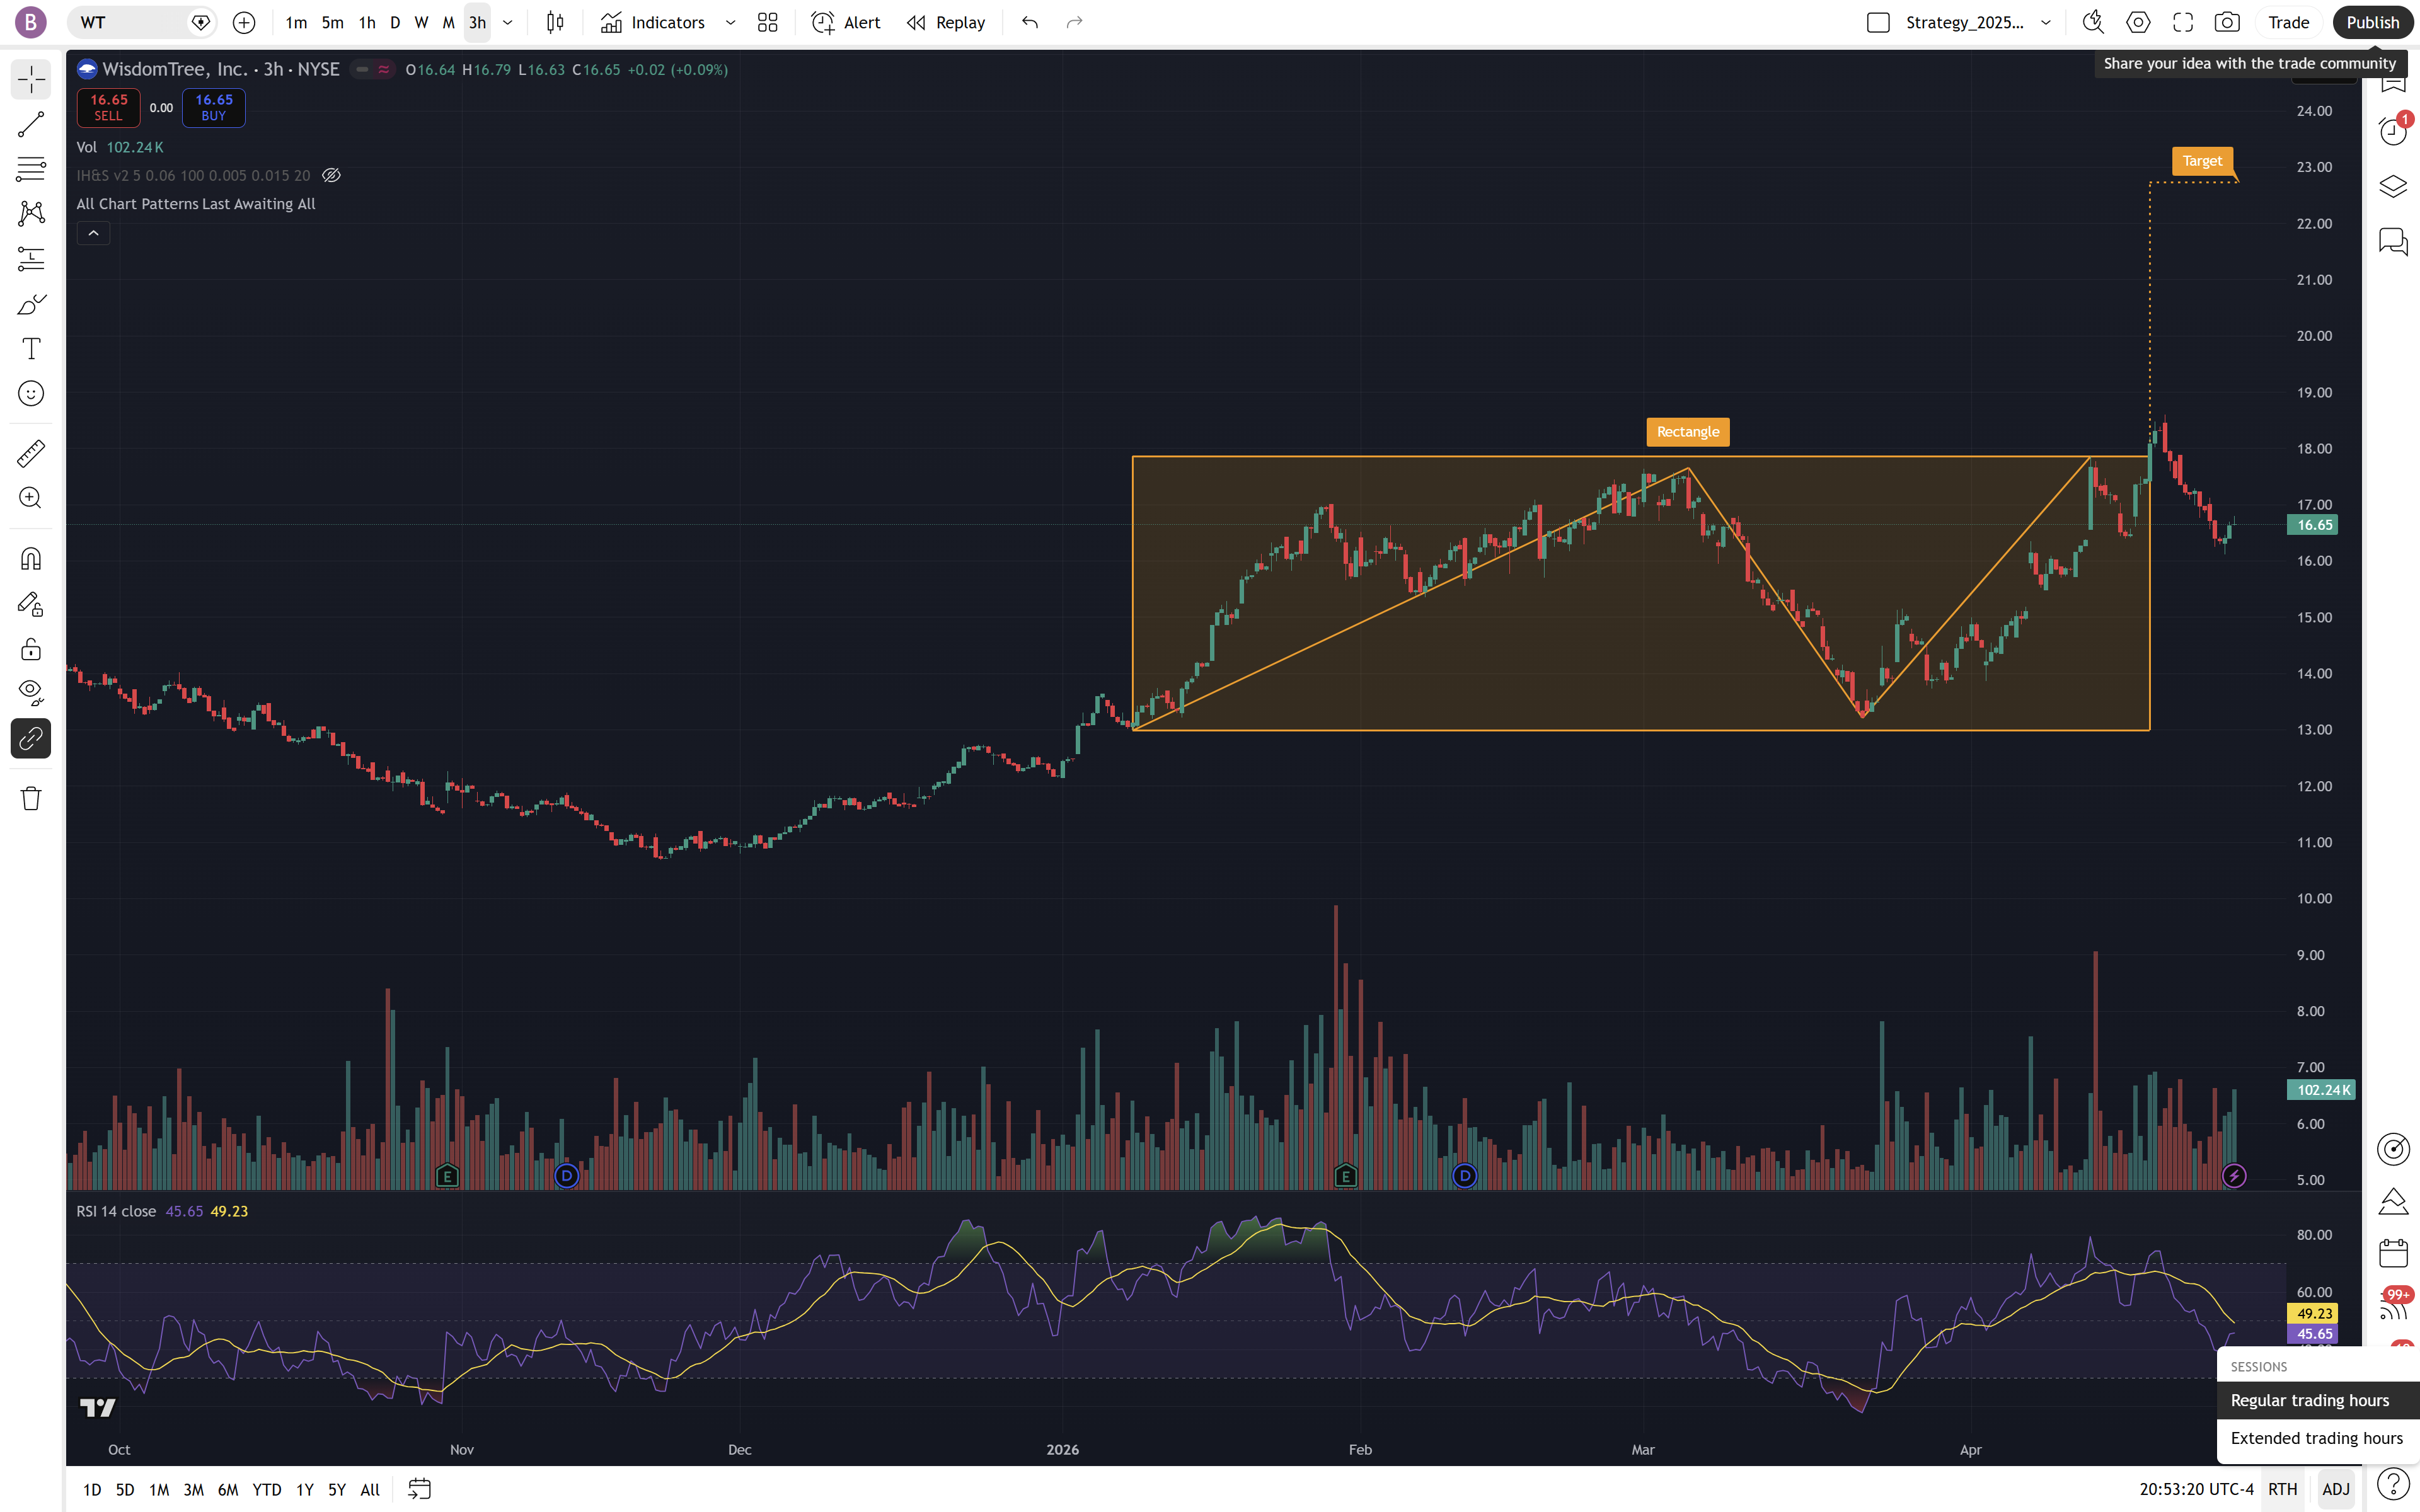
▲ Rectangle Accumulation
W-Pattern Confirmed
Target: $23.00
RSI ~45 — Mid-Range
3-Hour chart. Orange rectangle shows the accumulation zone ($14.50 – $18.00). Internal W-pattern (orange lines) indicates a successful retest of the base. Bullish breakout target (dashed orange line) projects to $23.00.
Ticker
WT
NYSE — WisdomTree
Current Price
$16.65
Mid-range accumulation
Breakout Level
i
The price level that, if broken with volume, confirms the end of accumulation and the start of a new uptrend.
$18.00
Rectangle Resistance
Base Support
$14.50
Rectangle Floor
Projected Target
$23.00
Breakout Measured Move
Hard Stop
i
The 'Exit' price. If price hits this level, the bullish thesis is invalidated and the trade should be closed to preserve capital.
$13.80
Below accumulation base
Pattern
i
The visual structure of price action. A 'Rectangle' shows a period of consolidation where buyers and sellers are in balance.
Rectangle
Accumulation / W-Base
Risk/Reward
i
The relationship between potential loss and potential profit. A 1:3 ratio means you risk $1 to make $3.
1 : 3.2
From $16.65 entry
Key Price Level Map
Bullish Targets
Primary Breakout Target
$23.00
Full measured move from the $3.50 rectangle height.
Resistance / Breakout Trigger
$18.00
Major rectangle ceiling. A close above this confirms the trend.
Support Zones
Mid-Range Consolidation
$16.50 – $16.80
Current price area. Accumulation ongoing.
Accumulation Floor
$14.50
Historical support where the W-pattern bottomed out.
Invalidation Level
$13.80
Stop loss. A breakdown here voids the bullish thesis.
Entry Plays — Long Setups
| # | Play | Signal Type | Status | Entry Zone | Stop Loss | TP1 | TP2 (Final) | Best R/R | Trigger Condition |
|---|---|---|---|---|---|---|---|---|---|
| 1 |
LONG-1
Support Bounce
|
LONG | PAST | ~$14.50 | $13.80 | $18.00 | $23.00 | 1 : 12.1 | Price tests $14.50 floor + RSI recovery |
| 2 |
LONG-2
Mid Momentum
|
LONG | LIVE / NOW | ~$16.65 | $14.50 | $18.00 | $23.00 | 1 : 3.2 | MACD cross + RSI > 45 in mid-range |
| 3 |
LONG-3
Breakout
|
LONG | PENDING | $18.00 – $18.25 | $16.50 | $21.00 | $23.00 | 1 : 3.3 | Close above $18.00 + volume spike |
| 4 |
LONG-4
Retest Long
|
LONG | PENDING | ~$18.00 | $17.00 | $21.00 | $23.00 | 1 : 5.0 | Post-breakout pull-back to old resistance |
Pine Script v6 Reference — AlertEdge.io_WT_Entry_Signals.pine
// Updated for Rectangle Accumulation Thesis
// Target: $23.00 | Support: $14.50 | Resistance: $18.00
LONG-1 Bounce → Green ● circle below bar | text = "BOUNCE"
LONG-2 Mid-Range → Blue ↑ arrow below bar | text = "MOMO"
LONG-3 Breakout → Orange ▲ triangle below bar | text = "BREAK↑"
LONG-4 Retest → Grey 🚩 flag below bar | text = "RETEST"
// Dashboard highlights the rectangle zone automatically
// Alert conditions tuned for $14.50 bounce and $18.00 breakout